My First Open Source Contribution to ArgoCD (And the Bug That Led Me There)
An engineer came to me with a simple complaint: their queue consumer wasn't keeping up with the queue. Messages were piling up. The consumer pods weren't scaling.
Everything looked fine.
1. The First Hypothesis
The first thing I checked was how the HPA was configured to scale. I half-expected to find it scaling on CPU — I've seen this enough times to go there first.
The mistake makes intuitive sense: more load, more CPU, more pods. But a queue consumer doesn't work that way. It pulls work from the queue at its own rhythm — fetch, process, fetch, process. The CPU stays roughly constant regardless of queue depth. You could have ten thousand messages waiting and the worker would be humming along at 30% CPU, perfectly content, doing nothing wrong, scaling nowhere. CPU is the wrong signal. Queue length is the right one.
This wasn't it. The HPA was configured correctly — scaling on queue length, not CPU. The external metric source was a DatadogMetric CRD, which surfaces a Datadog query as a Kubernetes metric the HPA can consume.
So the config was right in principle. Something else was broken.
2. The Investigation
The HPA was present. The DatadogMetric object was present. ArgoCD showed the application as healthy. No alerts, no errors in the logs, nothing obviously wrong.
I looked at the DatadogMetric object itself.
$ kubectl describe datadogmetric <name> -n <namespace>
The status had Valid: False and an error condition set. The CRD was failing to fetch the metric from Datadog — an auth or config issue. The HPA had no valid metric value to act on. With no metric, the autoscaler does nothing. Queue grows. Consumer stays at minimum replicas. Everything looks fine everywhere.
The failure was invisible because ArgoCD had no health check for DatadogMetric. Without a custom health check, ArgoCD defaults to Healthy for any CRD it doesn't know about. A broken DatadogMetric was indistinguishable from a working one — both showed green.
That matters more than it might sound. ArgoCD's app page is something product engineers check regularly — it's the first place anyone looks after a deploy. You don't need to know what a Kubernetes controller is to notice that your app has a red resource in it. But if everything is green, nobody looks further. A silent failure that looks healthy is the worst kind: it doesn't just go undetected, it actively signals that everything is fine.
3. How ArgoCD Health Checks Work
ArgoCD lets you define custom health checks for CRDs using Lua scripts. The script receives the resource and returns a health status — Healthy, Degraded, Progressing, or Missing. Without a registered check for a given CRD kind, ArgoCD falls back to Healthy.
The Datadog Cluster Agent sets two relevant conditions on DatadogMetric objects: Valid (is the metric query valid and returning data?) and Error (did something go wrong?). A metric in error has Valid: False or Error: True. Either state means the HPA has no usable metric.
The fix is a Lua health check that reads those conditions and returns Degraded when they indicate a problem:
hs = {}
if obj.status ~= nil then
  if obj.status.conditions ~= nil then
    for i, condition in ipairs(obj.status.conditions) do
      if condition.type == "Valid" and condition.status == "False" then
        hs.status = "Degraded"
        hs.message = condition.message
        return hs
      end
      if condition.type == "Error" and condition.status == "True" then
        hs.status = "Degraded"
        hs.message = condition.message
        return hs
      end
    end
  end
end
hs.status = "Healthy"
hs.message = "DatadogMetric is valid"
return hs
With this registered in resource.customizations in the ArgoCD ConfigMap, a broken DatadogMetric shows as Degraded — visually red in the ArgoCD UI — instead of silently healthy.
4. The Upstream Fix
The immediate fix was patching the ArgoCD ConfigMap in the cluster. But the check was generic — it works for any DatadogMetric object, not just this one. Leaving it as a local patch meant the next team to hit this would go through the same debugging process.
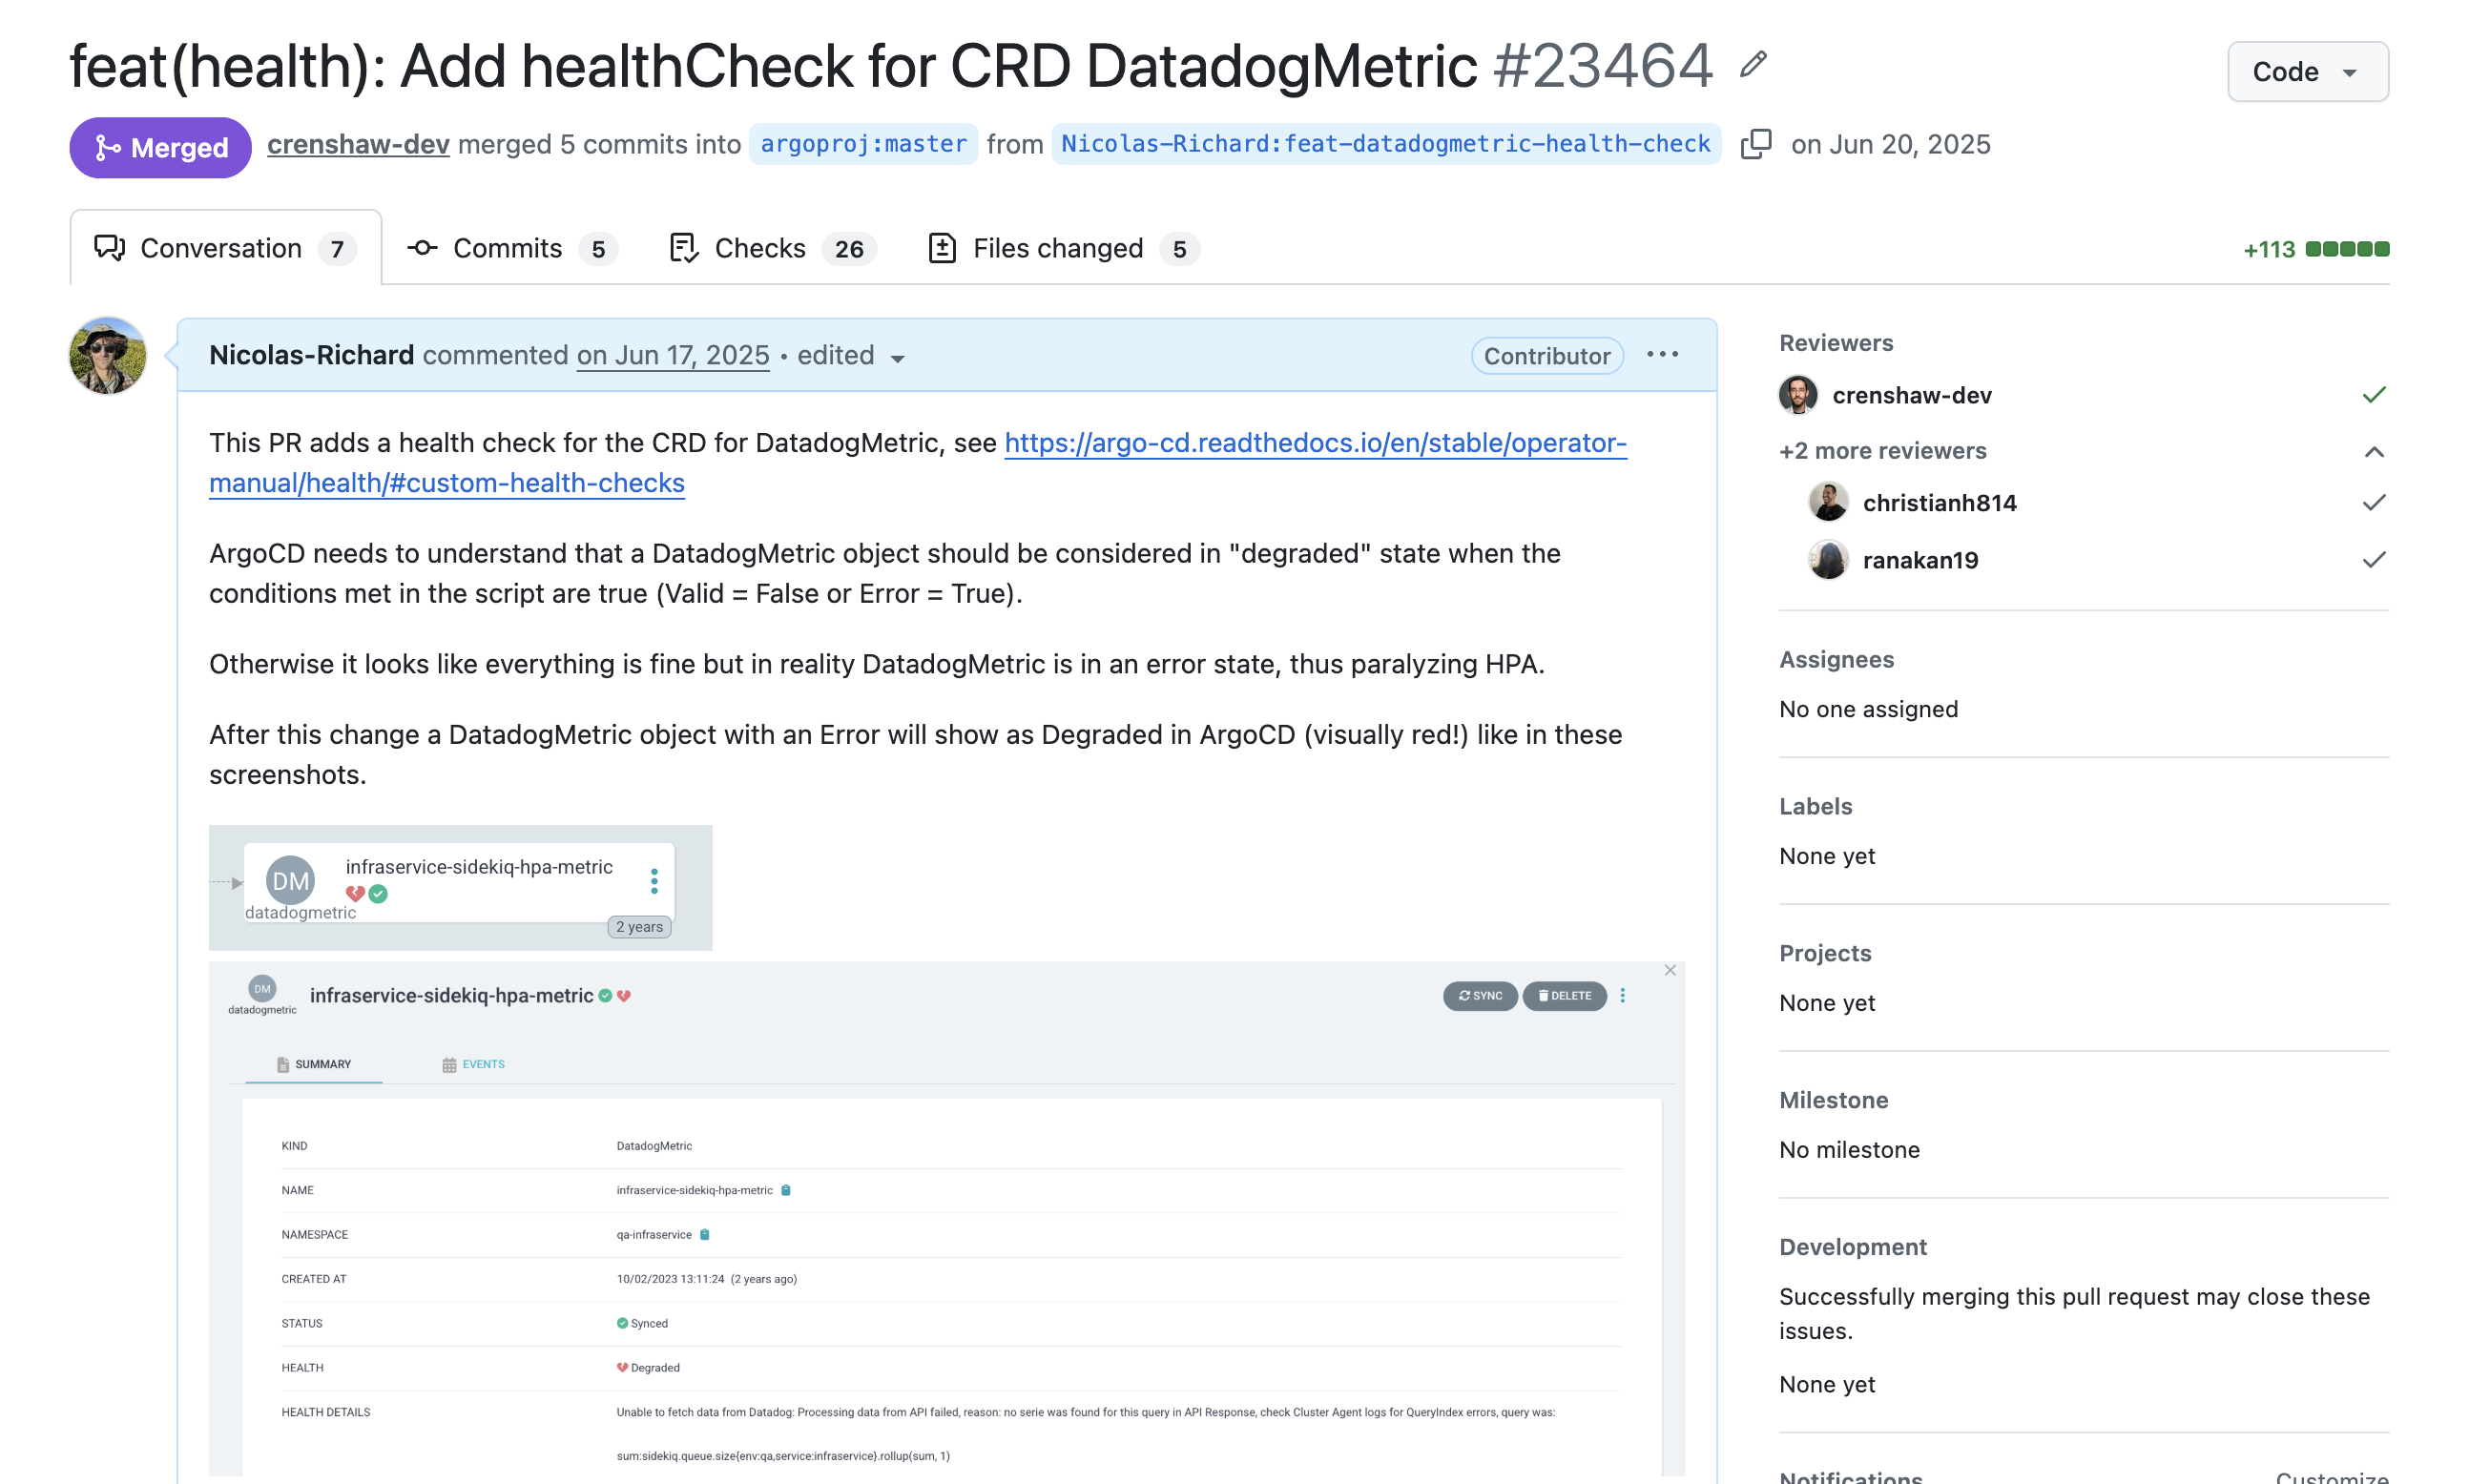
I contributed the health check to ArgoCD upstream, where it was reviewed and merged by three ArgoCD maintainers. It ships in ArgoCD by default now.
5. What Changed
The underlying HPA behavior doesn't change — it still can't scale without a valid metric. What changes is that the failure is now visible immediately, rather than discoverable only after someone notices the queue growing. A DatadogMetric in error state now shows as Degraded (red) in ArgoCD instead of silently healthy (green).
The Broader Pattern
The CPU scaling mistake and the silent DatadogMetric error are the same class of problem: the system behaves in a way that conflicts with a reasonable mental model, and the tooling doesn't surface the conflict.
Queue consumers scaling on CPU is wrong because the mental model — "busy worker = high CPU" — doesn't hold for polling workers. The fix is knowing the pattern.
A broken external metric showing as healthy is wrong because the mental model — "green in ArgoCD = healthy" — doesn't hold for CRDs without registered health checks. The fix is a Lua script and a pull request.
Both are worth keeping in mind the next time an autoscaler does nothing and everything looks fine.