Adaptive Concurrency on a Multi-Tenant vLLM Gateway: WFQ + AIMD Against a TTFT SLO
Fourth post in a series on running vLLM on EKS. The first covered the build. The second covered capacity. The third put a per-tenant concurrency cap in front of vLLM so a bursty tenant couldn't ruin latency for everyone else. This one replaces those static caps with two stacked control mechanisms: weighted fair queueing on top of a global budget, and a controller that continuously tunes the budget against an SLO.
What post #3 left on the table
The static-cap design from the previous post worked — a bursty tenant's p99 TTFT got isolated from a well-behaved tenant's p99 TTFT — but it had two honest weaknesses I called out in the last paragraph of that post.
It wasn't work-conserving. Tenant A had cap=64, tenant B had cap=8, tenant C had cap=64. When A and C were idle, B couldn't borrow their unused slots — B's pace was bounded by its own ceiling regardless of how much capacity the cluster had to spare. The cap protected isolation, but it left utilization on the floor whenever the busy tenant happened to be the low-cap one.
The cap values were hand-picked. The cap-sizing math cap = arrival_rate × E2E_response_duration × headroom looks tidy on paper but E2E_response_duration grows with offered load — vLLM's own batching slows down when the running set is too big to fit in KV cache. So the right cap at low load is too restrictive at high load, and the right cap at high load wastes capacity at low load. There's no single number that's correct for every operating point.
This post replaces the three per-tenant semaphores with a two-layer system that fixes both gaps.
- Weighted fair queueing (WFQ) over a single global budget. Per-tenant queues, one global concurrency semaphore, a deficit round-robin loop draining the queues into the semaphore. When other tenants are idle, an active tenant can use the entire budget. When everyone is active, dispatch is split by weight.
- An AIMD (additive-increase / multiplicative-decrease) control loop that tunes the global budget continuously, against an observed-latency SLO. The operator sets a target p99 TTFT; the controller does the rest.
The result, jumping ahead, looks like this:
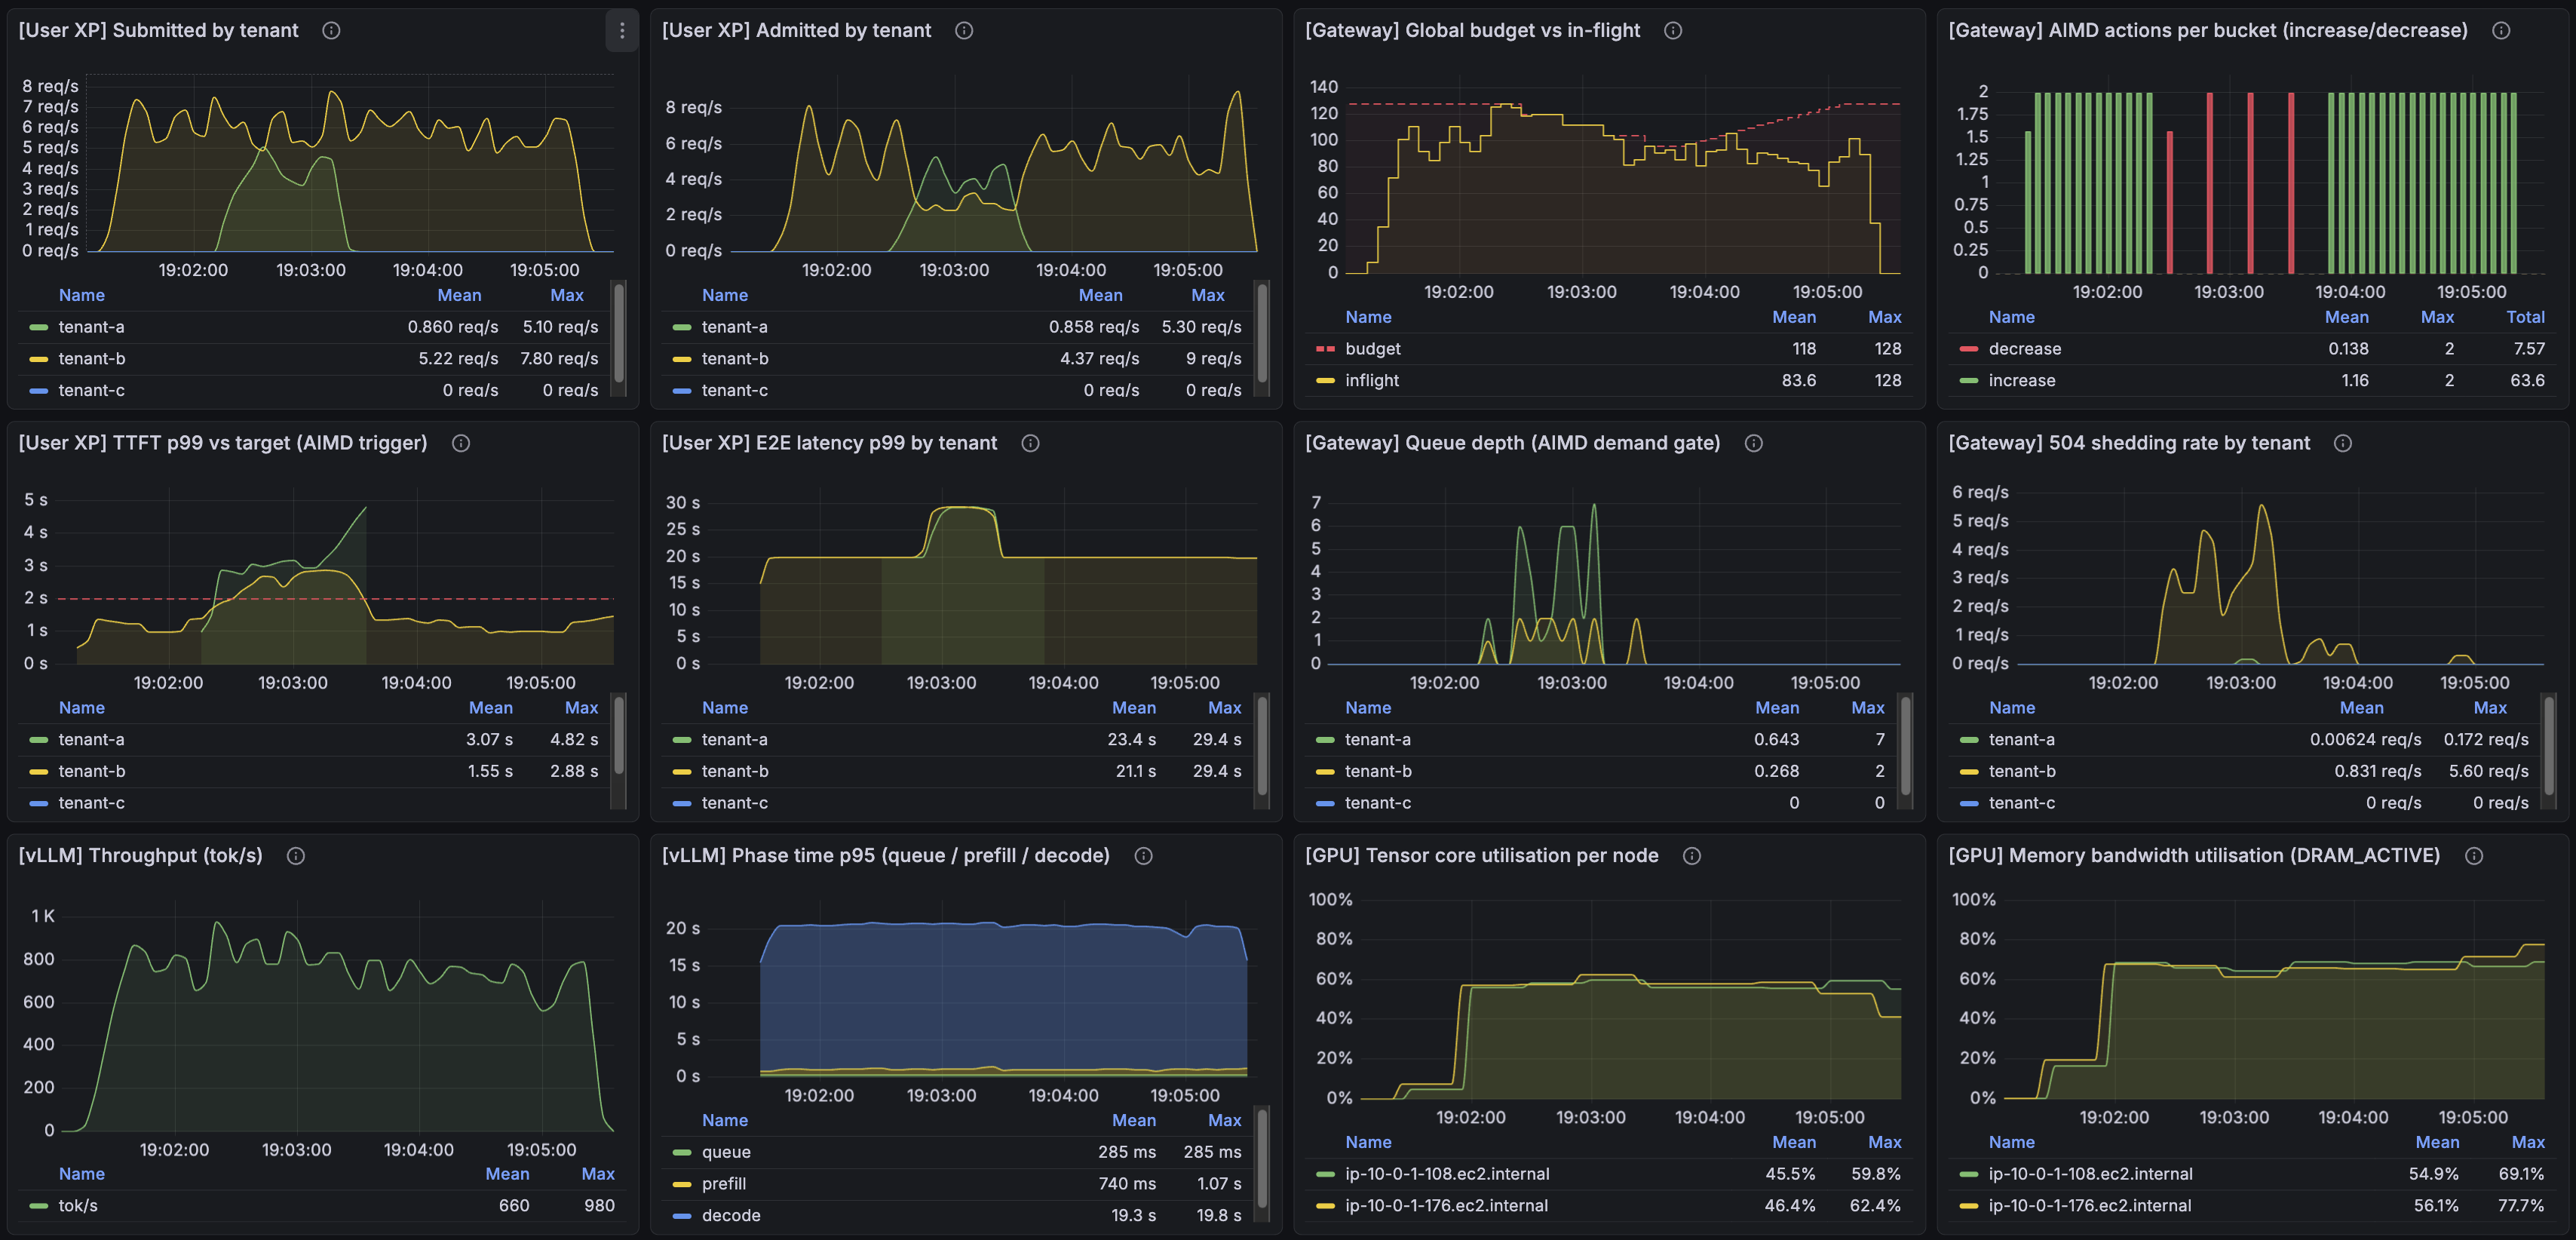
Top-left two panels: both tenants submitting and being admitted (no shedding for the paying tenant, significant shedding for the free tier). Top row, third panel: the global budget breathing — the run bootstrapped from cap_per_worker=64 (initial budget = 64 × 2 workers = 128), and AISD has grown it slightly to park around 135 in-flight. Top-right: the controller's per-bucket increase (green) and decrease (red) actions. Middle-left: tenant-A's p99 TTFT against the 2 s target — it briefly breaches above the line a few times, which is what triggers the controller's decrease actions, and each time the descent pulls things back into band. What you're seeing is the controller actively defending the SLO, not effortlessly riding under it. Bottom row: vLLM throughput, phase time, GPU tensor utilization, GPU memory bandwidth — all running hot.
The rest of the post is how I got there, including a few things that bit me.
Act 1: weighted fair queueing on a global budget
The structural change is in two pieces.
Per-tenant queues replace per-tenant semaphores. Each tenant gets a bounded asyncio.Queue(maxsize=queue_max). A request hits the gateway, gets authenticated, and is enqueued onto its tenant's queue. Queue full → 504 immediately. The queue_max is still a per-tenant ceiling — that part hasn't gone away — but it's no longer the capacity knob it was in post #3. It's the depth of the buffer that absorbs short bursts before shedding starts; the actual capacity decision moves to a single global budget shared across tenants.
A single global semaphore replaces the three per-tenant semaphores. Sized to num_workers × cap_per_worker, this semaphore is the budget — the total concurrent in-flight requests the gateway is willing to have outstanding against vLLM at any moment. One number, one mutable knob.
A deficit round-robin (DRR) drain loop is what connects the two. A single async task runs forever, walking the per-tenant queues in order. Each tenant has a weight (an integer); on each round, the loop adds the weight as "deficit credit" and dispatches as many requests from that tenant as the credit allows, subject to the global semaphore having room. An idle tenant's deficit doesn't accumulate — once your queue empties, your credit resets — so DRR is automatically work-conserving: an active tenant's pace is bounded only by the global semaphore and its own weight share, not by anyone else's allocation.
I picked DRR because it's the smallest change that achieves work-conservation with weights. There's a more rigorous virtual-time formulation of weighted fair queueing that I didn't reach for; at three tenants, the difference doesn't show up at the granularity I care about, and the integer-credit version is meaningfully simpler to implement and reason about.
Demonstrating work conservation and priority
The cleanest demonstration of DRR's behavior is a two-tenant scenario with different weights. Tenant B is a free-tier user (weight=1) running the whole length of the run. Tenant A is a paying user (weight=2) that bursts in the middle.
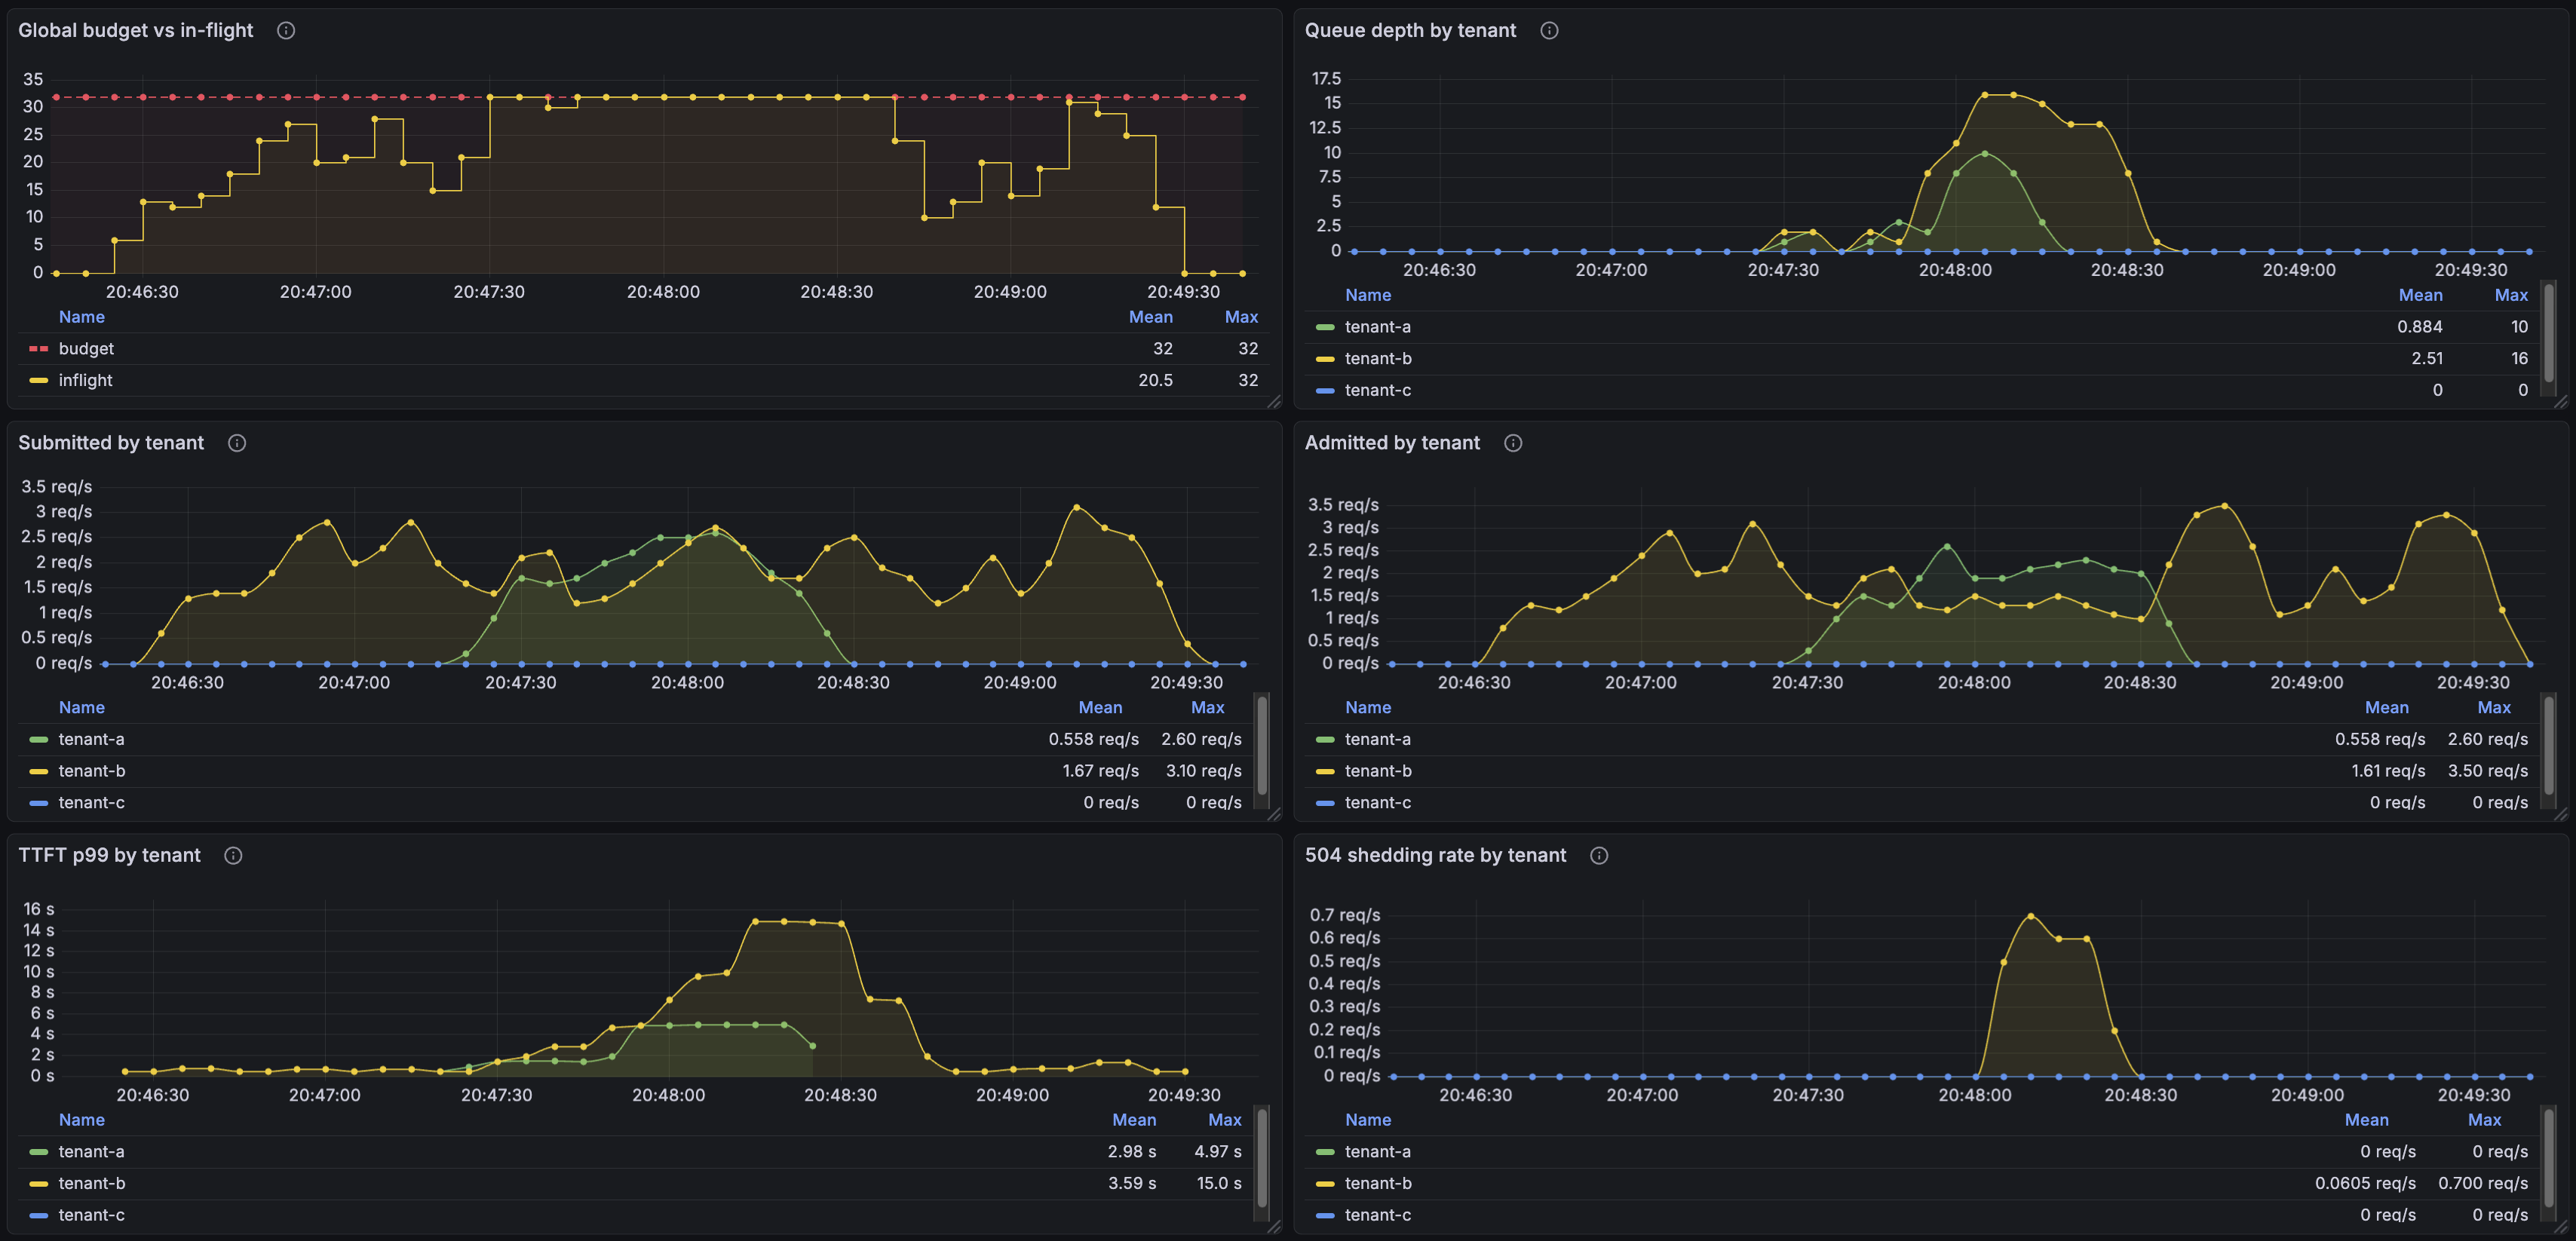
Top-left: global budget pinned at 32, in-flight tracking the budget as load fills it. Before A's burst, B is alone — and DRR happily lets B use the full budget. The point of work-conservation is right there: there's no per-tenant ceiling preventing B from saturating the global capacity when nobody else is competing for it.
When A's burst arrives, the picture changes. The submitted/admitted panels show A consuming roughly two-thirds of the dispatches while B drops to about one-third — that's the 2:1 weight ratio expressing itself. The 504 shedding panel shows B's overflow, since A's higher weight is now claiming the larger share of the budget and B's queue is filling faster than it drains.
That's the WFQ payload: when nobody is competing, the active tenant gets everything; when there's contention, allocations split by weight; the lower-priority tenant absorbs the cost.
We've solved work-conservation and we've solved priority, but we don't know what number to pick for the budget. That's what the next layer is for.
Act 2: AIMD on cap_per_worker
To build the control loop I need a metric to watch. I picked p99 TTFT — the user-visible latency that matters for an interactive workload, already collected as a histogram in the gateway, and responsive to changes in concurrency. That same metric, expressed as a target, naturally becomes the one config setting I expose to the operator: pick 2 seconds, walk away. The controller's job is to find the largest cap_per_worker that holds p99 below it.
The shape I started with is classical TCP-style AIMD: additive-increase / multiplicative-decrease.
every tick (5 s):
    p99 = observe_p99_ttft(window=30s)
    if p99 < target and we have demand:
        cap_per_worker += 1                # additive increase
    elif p99 > target:
        cap_per_worker //= 2               # multiplicative decrease
    else:
        hold
AI is the optimizer (climb until something pushes back). MD is the safety mechanism (back off when SLO is violated). AIMD has a target that means something concrete (the SLO).
The signal source is the gateway's own p99 TTFT histogram, not a Prometheus query — same metric the dashboard reads, no second source of truth, no scrape-vs-tick race conditions.
The result, the first time I deployed and ran a noisy-neighbor scenario, was a controller that drove cap_per_worker to its floor and parked there for the entire run, with p99 sitting at 17 seconds. Several rebuilds later it works. Here's what I had to fix.
What it took to make AIMD actually work
1. Which TTFT to feed the controller
vLLM has its own first-token latency metric, measured inside the engine from the moment the prompt enters its scheduler. That is not what the user experiences. The user's TTFT starts when their HTTP request hits the gateway and ends when the first chunk of the response comes back to their client — which includes anything that happens to the request in between, including time it spends sitting in the gateway's scheduler queue waiting for a slot.
For a controller whose job is to defend a user-visible SLO, the only signal that matters is the user-visible one. Here's where that measurement falls in the request lifecycle:
Client
  │
  └── HTTP request arrives
      │
      t1 ─── middleware entry   ┐
      │                         │ scheduler queue wait
      │     scheduler.acquire   │ (under DRR contention: 0 → 30s)
      │                         │
      t2 ─── slot acquired      ┘
      │
      │     proxy_to_router builds request
      │     httpx.send to vLLM
      │
      t3 ─── HTTP request sent to upstream
      │
      │     vLLM prefills prompt, returns headers
      │
      t4 ─── upstream status received  ┐
      │                                │ upstream TTFT
      │     wait for first token       │ (vLLM's first-token decode)
      │                                │
      t5 ─── first chunk yielded   ────┘   ← gateway_ttft_seconds records t5 − t1
      │
      ... streaming continues
      │
      t6 ─── last chunk
      │
      t7 ─── middleware finalize  → records gateway_request_duration_seconds = t7 − t1
The gateway emits gateway_ttft_seconds measured across t5 − t1 — middleware entry to first chunk yielded — which is exactly what the user perceives as TTFT. AISD reads that histogram. Anything that lengthens that span — queue wait at high contention, slow prefill at high concurrency, vLLM preempting and re-running a sequence — is a real cost from the user's perspective and a signal the controller is right to react to.
This choice has a consequence the next subsection unpacks: when the gateway's queues fill up, queue wait time shows up in the same p99 the controller reads. That's correct behavior — the user did wait — but it changes what the controller sees, and that changed what I had to do.
2. queue_max=16, the death spiral, and the floor on cap_per_worker
The first deploy used queue_max=16. With a steady offered rate above the dispatch rate, queues filled and stayed full. Every request now spent significant time waiting in the queue before getting dispatched, and that wait is part of what the controller measures — gateway_ttft_seconds from the previous section spans queue wait too.
The death spiral followed: AIMD reacted to large p99 by halving cap → slower dispatch → longer queue wait → higher p99 → another halving. Two minutes in, cap was at the floor, p99 was 17 seconds, and the GPUs were lightly loaded. The controller had walked the system into a regime where the response to "latency is bad" was making latency worse.
Why "cap at the floor" was actively bad, not just slow. Below a certain concurrency level, the GPU and vLLM are less performant per token, not more. Two reasons:
- Weight bandwidth amortization. Each forward pass has to read the model's weights through memory once — about 14 GB at ~300 GB/s, so ~47 ms minimum no matter how big the batch is. With a wide batch, that fixed cost is amortized over many tokens being decoded in parallel. With a narrow batch, the per-token share of that fixed cost is large, and per-token decode time stretches.
- vLLM's continuous batching needs sequences to pack. vLLM packs as many in-flight sequences as KV cache allows into each forward pass. With only a handful of sequences in flight, there's nothing to pack — the engine spends compute on the same fixed prefill/decode work but produces much less per-pass output.
So the floor isn't an arbitrary safety belt — it's the boundary below which AIMD's instinct to reduce concurrency makes things worse instead of better. This is very visible in the AISD sweep panel "TTFT p99 vs target": In the run where admitted requests is the lowest TTFT climbs into the ~20 s range.
Fix #1: a hard floor on cap_per_worker. AISD never reduces below cap_per_worker_min=16. The controller can decrease the budget when the SLO is breached, but it can't decrease past the regime where decreasing helps. The number is empirical for this model on this GPU; on different hardware or a different model it would be different.
Fix #2: a tight queue. The floor stops the system from getting stuck at the bottom, but it doesn't stop the death spiral — it just relocates where the system gets stuck. The actual cure is to make queue wait small relative to TTFT, so the controller's signal reflects what the GPU is doing rather than how deep the queue is. The fix is to make the queue small enough that queue wait is a tiny fraction of TTFT. With queue_max=2, queue wait is bounded to a few hundred milliseconds. AIMD's signal then reflects what the GPU is actually doing.
The catch with tight queues: bursty arrivals. vllm bench serve --request-rate 4 produces a mean of 4 rps, not a steady 4 rps; small clusters of arrivals within a few hundred milliseconds are routine. With queue_max=2, those clusters trigger immediate 504s on arrival, before DRR has any chance to express the tenant's weight. A weight-2 paying tenant ended up shedding 21% of its requests purely from arrival-burst noise.
The fix was to split queue_max by tier. Paying tenants get queue_max=8 — enough to absorb arrival bursts without queue wait dominating TTFT. Free-tier tenants get queue_max=2 — fast 504s, no buffering for the noisy neighbor.
3. The demand gate must count in-flight, not just queued
The original AI gate fires when "any tenant has a non-empty queue" — TCP-style "only grow while you have packets to send." But with queue_max=2 and a moderate offered rate, the healthy steady state has queue=0 most of the time: each request finishes before the next arrives. AIMD read this as "no demand," refused to grow cap, and got stuck below the operating point even while the system was actively serving traffic. The fix: has_demand() = _inflight > 0 OR any_queue_nonempty(). A request mid-prefill is still demand; it should keep AI alive.
4. Switching MD to a subtractive step (AISD)
Even with the floor and the tight queue, halving by 50% per MD event seemed excessive — cap went 64 → 32 → 16 in three ticks, and each tick was reacting to the last overcorrection rather than to the current state. I replaced cap //= 2 with cap -= decrease_step (default 4) and renamed the controller AISD — additive-increase / subtractive-decrease. Walking 64 → 60 → 56 gives each tick a chance to observe whether the smaller cap actually helped before the next reduction.
Honest take: the problem with halving was the factor (1/2), not multiplication itself — 0.8 or 0.9 would probably have worked. Subtractive doesn't scale with cap size (decrease_step=4 is a 6% cut at cap=64 but 25% at cap=16), so MIMD is arguably the cleanest shape for a variable that spans an order of magnitude. I got confused, switched to subtractive, the system stabilized, and I moved on.
Update (post #5): This turned out to be the wrong call. When building the autoscaler in post #5, I went back to validate the inner loop under sustained 20 rps and found the SLO wasn't being held cleanly — the real culprit was the queue acquire timeout sitting at 30 s, fifteen times the 2 s SLO. A request that had already waited 30 s in queue was a lost cause; serving it fed a chain reaction rather than clearing pressure. Cutting the timeout to 1 s fixed the death-spiral instinct that had made multiplicative decrease feel too aggressive in the first place. With that fixed, I switched back to AIMD — the classic sawtooth reacts faster to overshoots than a fixed subtractive step, and at the corrected timeout the overcorrection problem no longer appears. The AISD design in this post works, but it was stabilizing a symptom. See post #5 for the corrected controller.
5. Limiting thrashing: deadband and asymmetric cooldown
Even with a gentle descent, two more things were causing the controller to thrash near the operating point.
Deadband around the target. Without one, p99 jittering near the SLO (1.9 s, 2.1 s, 1.95 s) flipped AISD's direction every tick. Each flip is a real action — climb, descent, climb — and on the dashboard it looked like thrashing even when the system was honestly at its operating point. A deadband fixes this: AI fires only when p99 < target × 0.8, MD/AISD fires only when p99 > target × 1.2, and the band in between is a "no action" zone. Same reactivity to genuine overshoots, much less twitching at the operating point.
Cooldown on the descent side only. After a decrease, the rolling p99 window still contains stale samples from before the cap dropped. Without a cooldown, the next tick reacts to those stale samples and decreases again — compounding the overshoot. A 3-tick (15 s) hold after each MD/AISD lets the window flush.
I deliberately did not apply the cooldown to AI. Forcing AI to wait would cap the climb rate at +1 cap per (1 + cooldown) ticks, which on a 5 s tick with cooldown=3 means cap=2 → cap=8 takes 2 minutes. The cost asymmetry runs the right way for asymmetric cooldown: backing off is careful (small step, then wait); climbing is eager.
Seeing it in action
The headline panel from the top of the post (4-1) is the AISD-on noisy-neighbor run: two tenants under sustained pressure, AISD has parked the budget around 135 in-flight, p99 oscillates around the 2 s target with the controller actively defending it on each breach. To make the comparison clean I ran a sweep with AISD disabled across cap_per_worker_initial ∈ {16, 32, 64, 128, 256}, and a wider AISD-enabled sweep across cap_per_worker_initial ∈ {4, 8, 16, 32, 64, 128, 256}. The runs are short, so the choice of starting cap matters — different starting points behave very differently. I was looking for the sweet spot, and without AISD it sits around 32 for this scenario.
AISD off (DRR alone, static budget across the sweep):
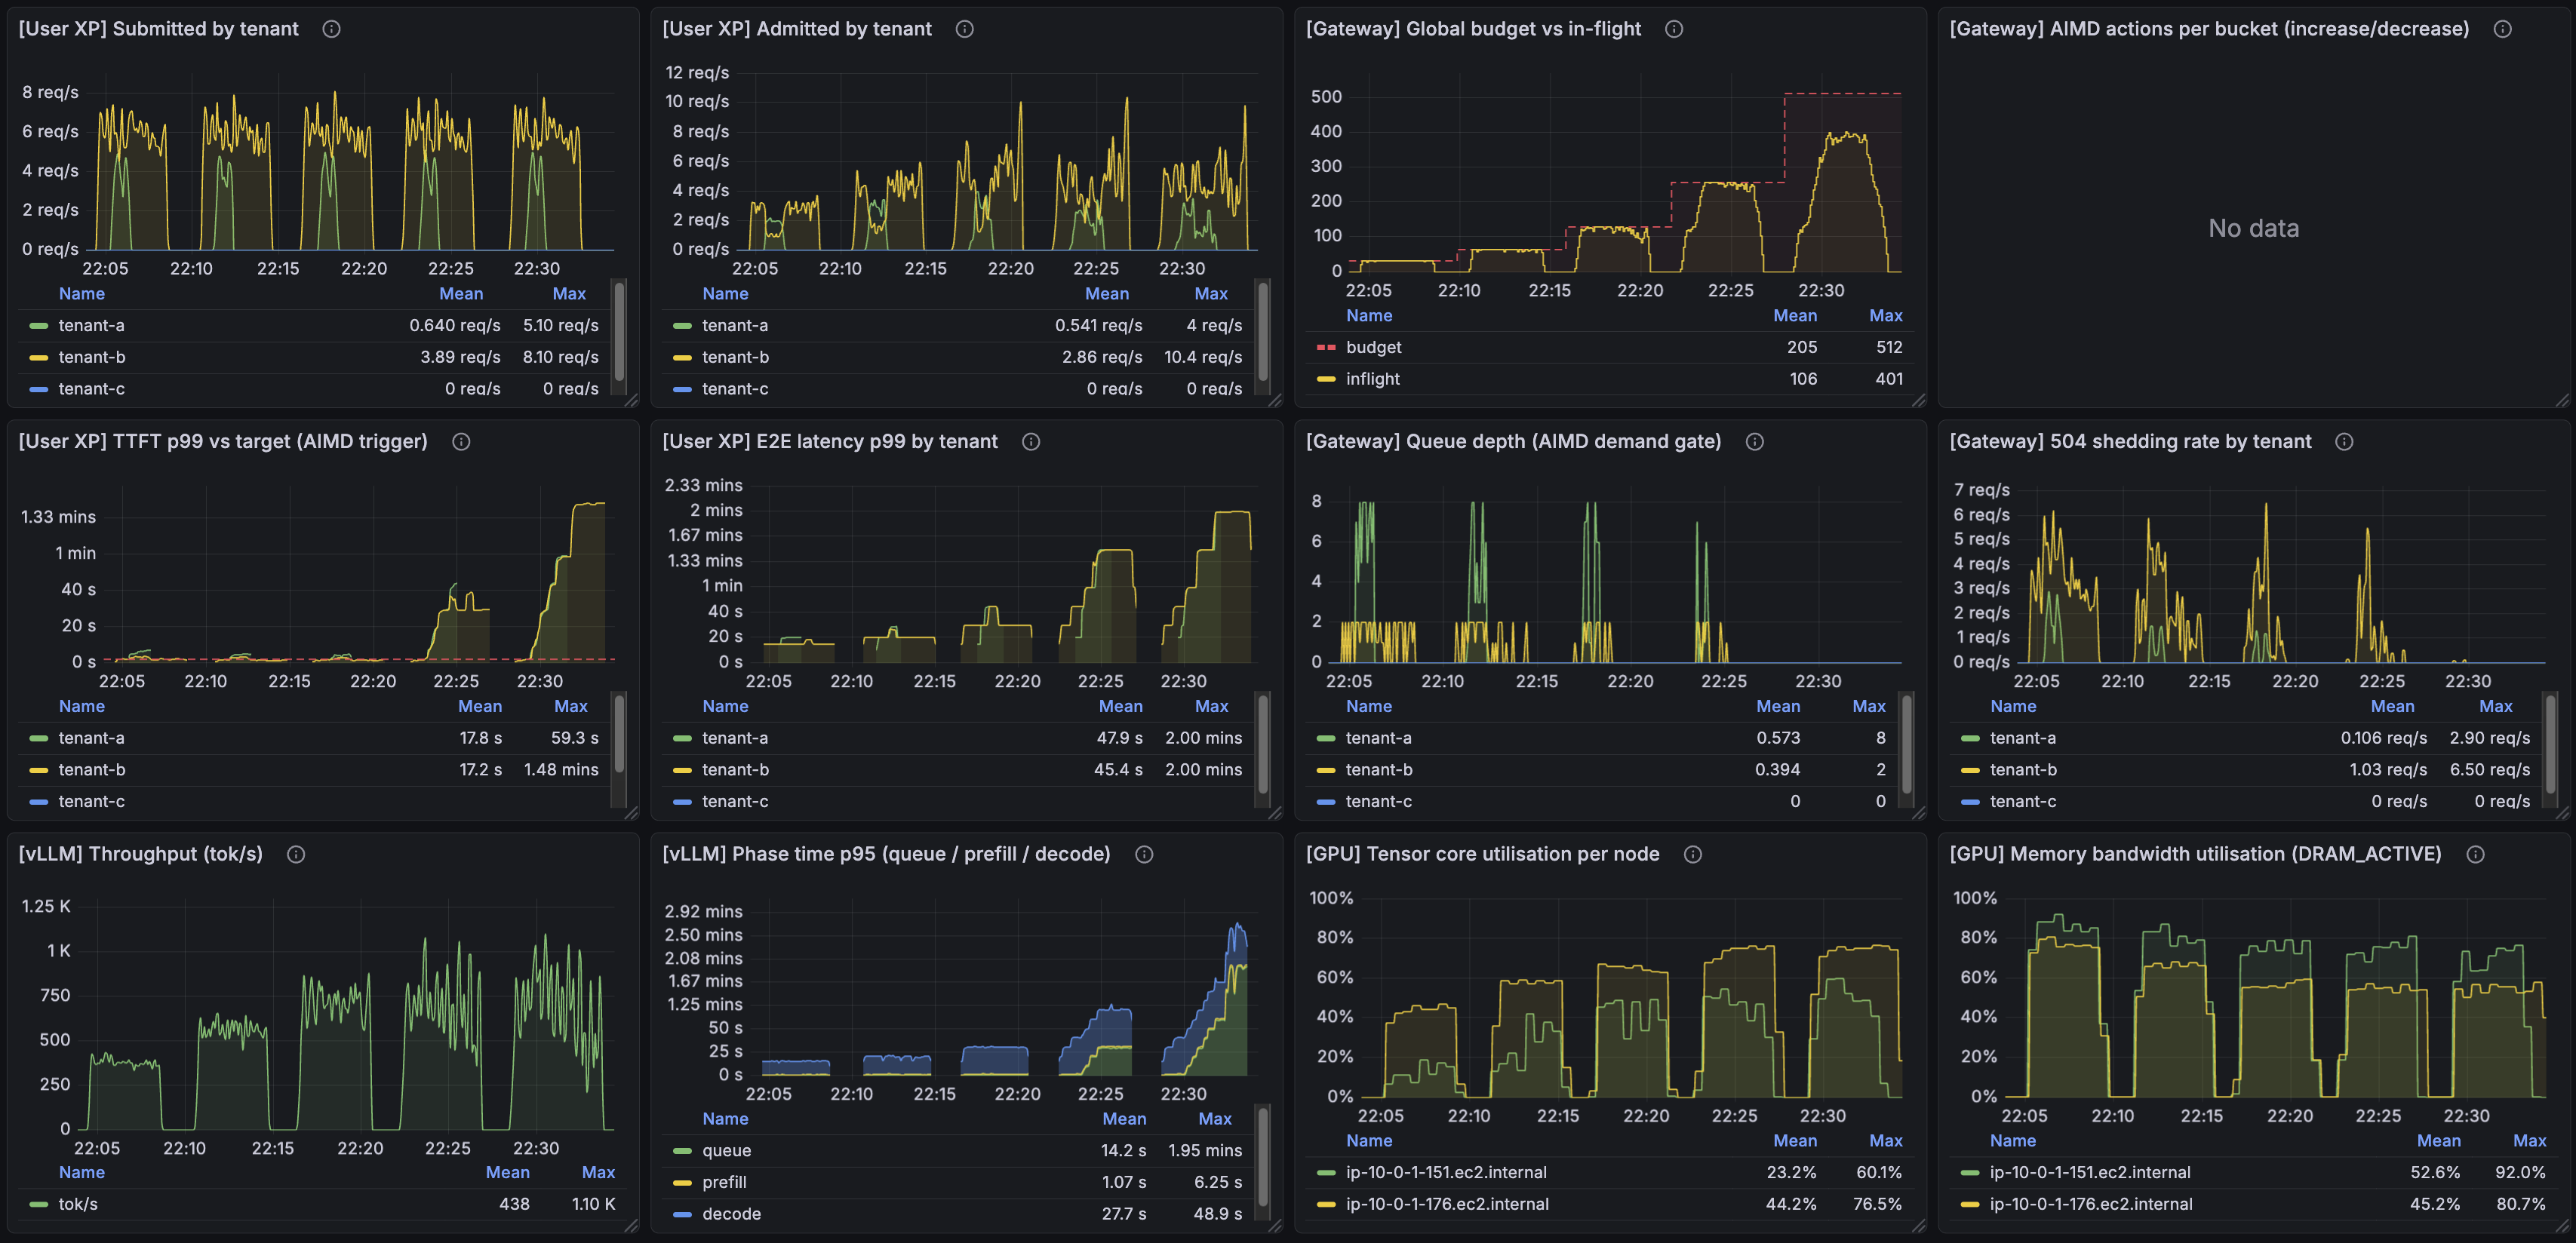
AISD on, same sweep, same offered load:
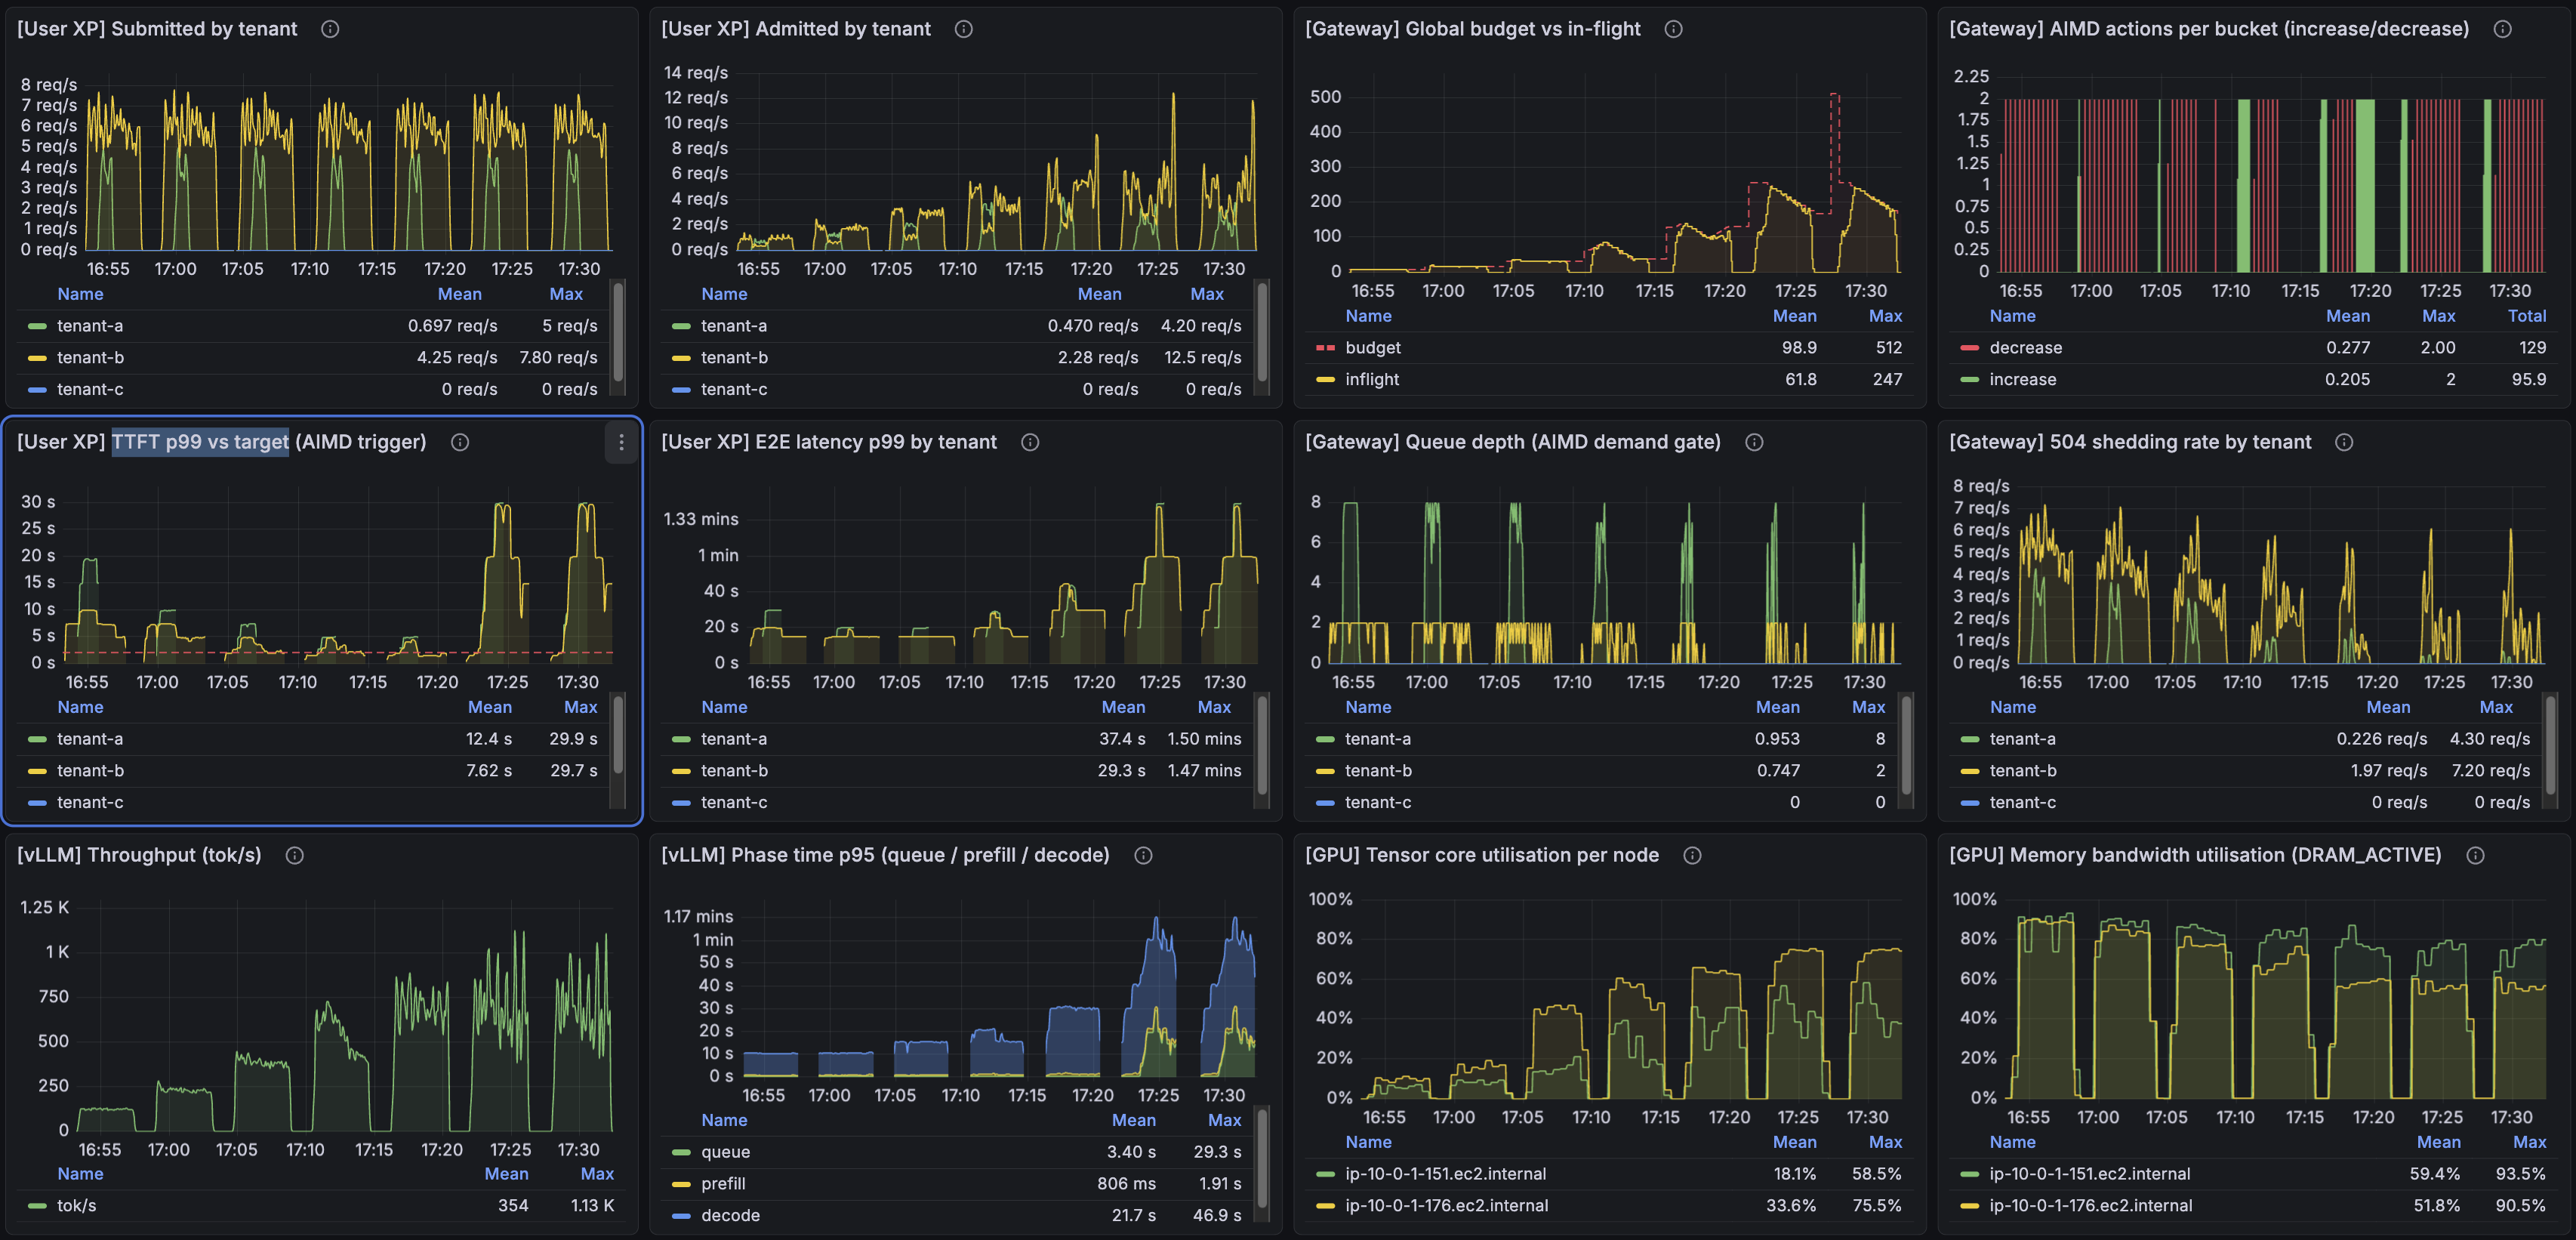
There are a lot of interesting things to notice in these images...
Here's one I like: past a certain point, admitting more traffic makes the system worse, not better. The effect is most visible in E2E latency in both sweeps. But TTFT, in this overload regime, is roughly 3× lower with AISD than without it. The controller is buying TTFT back even when the offered load is well past what the GPUs can serve cleanly.
What's even more interesting is inside the AISD sweep itself. Notice how the "TTFT p99 vs target" panel traces out a U-curve across the sweep — TTFT is high at both small and large rate of request admission, and low in the middle, at the budget's sweet spot.
My favorite : Compare cap_per_worker_initial=64 (the third-to-last run in the sweep) with cap_per_worker_initial=128 (the second-to-last). Both runs shed a similar amount of traffic, and total throughput in tokens/sec is roughly the same (visible in the bottom-left panel). But the user-visible latency is completely different: TTFT at 128-init is about 6× higher than at 64-init, and E2E latency is about 3× higher. Same throughput, very different user experience.
Finding this threshold is exactly what AIMD will excel at against an ever changing load pattern!
The right cap_per_worker_max is workload-shaped. Raising the ceiling gives AISD more headroom to find the operating point under heavy load; lowering it shortens the climb on cold start at the cost of a less-aggressive operating point under steady state. What I took away from tuning this is that cap_per_worker_max is a budget for the controller to explore inside, not a ceiling to hit.
Limits of this design
Single-replica gateway. All this scheduling state lives in the process — queues, semaphore, AISD window. If I ran two gateway replicas, I'd need shared state (Redis or similar) for the global budget, or I'd have two controllers doing uncoordinated AISD against the same backend. Out of scope for this demo; flagged for the v3 thinking pile.
Scheduling is reactive not predictive. AISD controls how many requests can be outstanding to vLLM at once; what vLLM does inside its batch is up to vLLM's continuous-batching scheduler. The gateway's view stops at "how saturated is the system overall, by latency?" That's enough for the SLO defense, but it's also why the controller is a reactive optimizer rather than a model-driven planner.
The final config
All of this is infrastructure-as-code — Terraform, Helm, and a small YAML for the gateway scheduler's config. Iteration on AISD knobs, queue sizes, and tenant weights was a config edit and a re-deploy, which is what made running through dozens of tuning cycles tractable.
caps_enabled: true
num_workers: 2
cap_per_worker: 64           # bootstrap
aimd:
  enabled: true
  target_p99_ttft_s: 2.0     # the only operator knob
  tick_s: 5.0
  window_s: 30.0
  cap_per_worker_min: 16
  cap_per_worker_max: 128
  target_band_pct: 0.2       # ±20% deadband
  cooldown_ticks: 3          # forced hold after a decrease
  decrease_step: 4           # AISD subtractive step
tenants:
  - id: tenant-a   weight: 2 queue_max: 8     # paying tier
  - id: tenant-b   weight: 1 queue_max: 2     # free tier
  - id: tenant-c   weight: 1 queue_max: 2
What's next
Horizontal scaling on num_workers. The next thing to add is letting the cluster grow and shrink GPU workers under the gateway, with HPA driven by an inference-meaningful signal — the controller's own action history (frequent decreases = under-provisioned), latency vs target, or KV cache pressure — instead of CPU utilization. Post #5 territory.
Repo
Terraform, Helm, gateway code (apps/fastapi-gateway/app/scheduler/ for the DRR + AISD implementation), bench scenarios, and the dashboard JSON used for the screenshots above are all in the public repo. The runs in this post are reproducible end-to-end against a fresh cluster.