Autoscaling a GPU Fleet on Inference-Aware Signals
Fifth post in a series on running vLLM on EKS. The first covered the build. The second covered capacity. The third put a per-tenant concurrency cap in front of vLLM. The fourth replaced those caps with weighted fair queueing on a global budget and an AIMD controller tuning the budget against a TTFT SLO. This one makes the fleet itself elastic — adding a second control loop that grows and shrinks num_workers on inference-aware signals.
What post #4 left on the table
Post #4's gateway saturated a fixed fleet — DRR + AIMD against a 2 s TTFT SLO, two vLLM workers. That worked while offered load fit in the fleet's serving envelope. When I pushed tenant A to 20 rps sustained, AIMD bottomed out: the controller did its job and shed rather than letting TTFT degrade, but the only way to actually serve the offered load is to add capacity.
The fixed-fleet trap is one or the other: oversize the fleet and pay for idle GPU-hours, or undersize it and shed at every traffic peak. The fix is to make num_workers itself elastic and let the system answer two questions on its own: how many more GPUs do we need, and when.
This post adds the outer control loop that answers both. The result, jumping ahead:
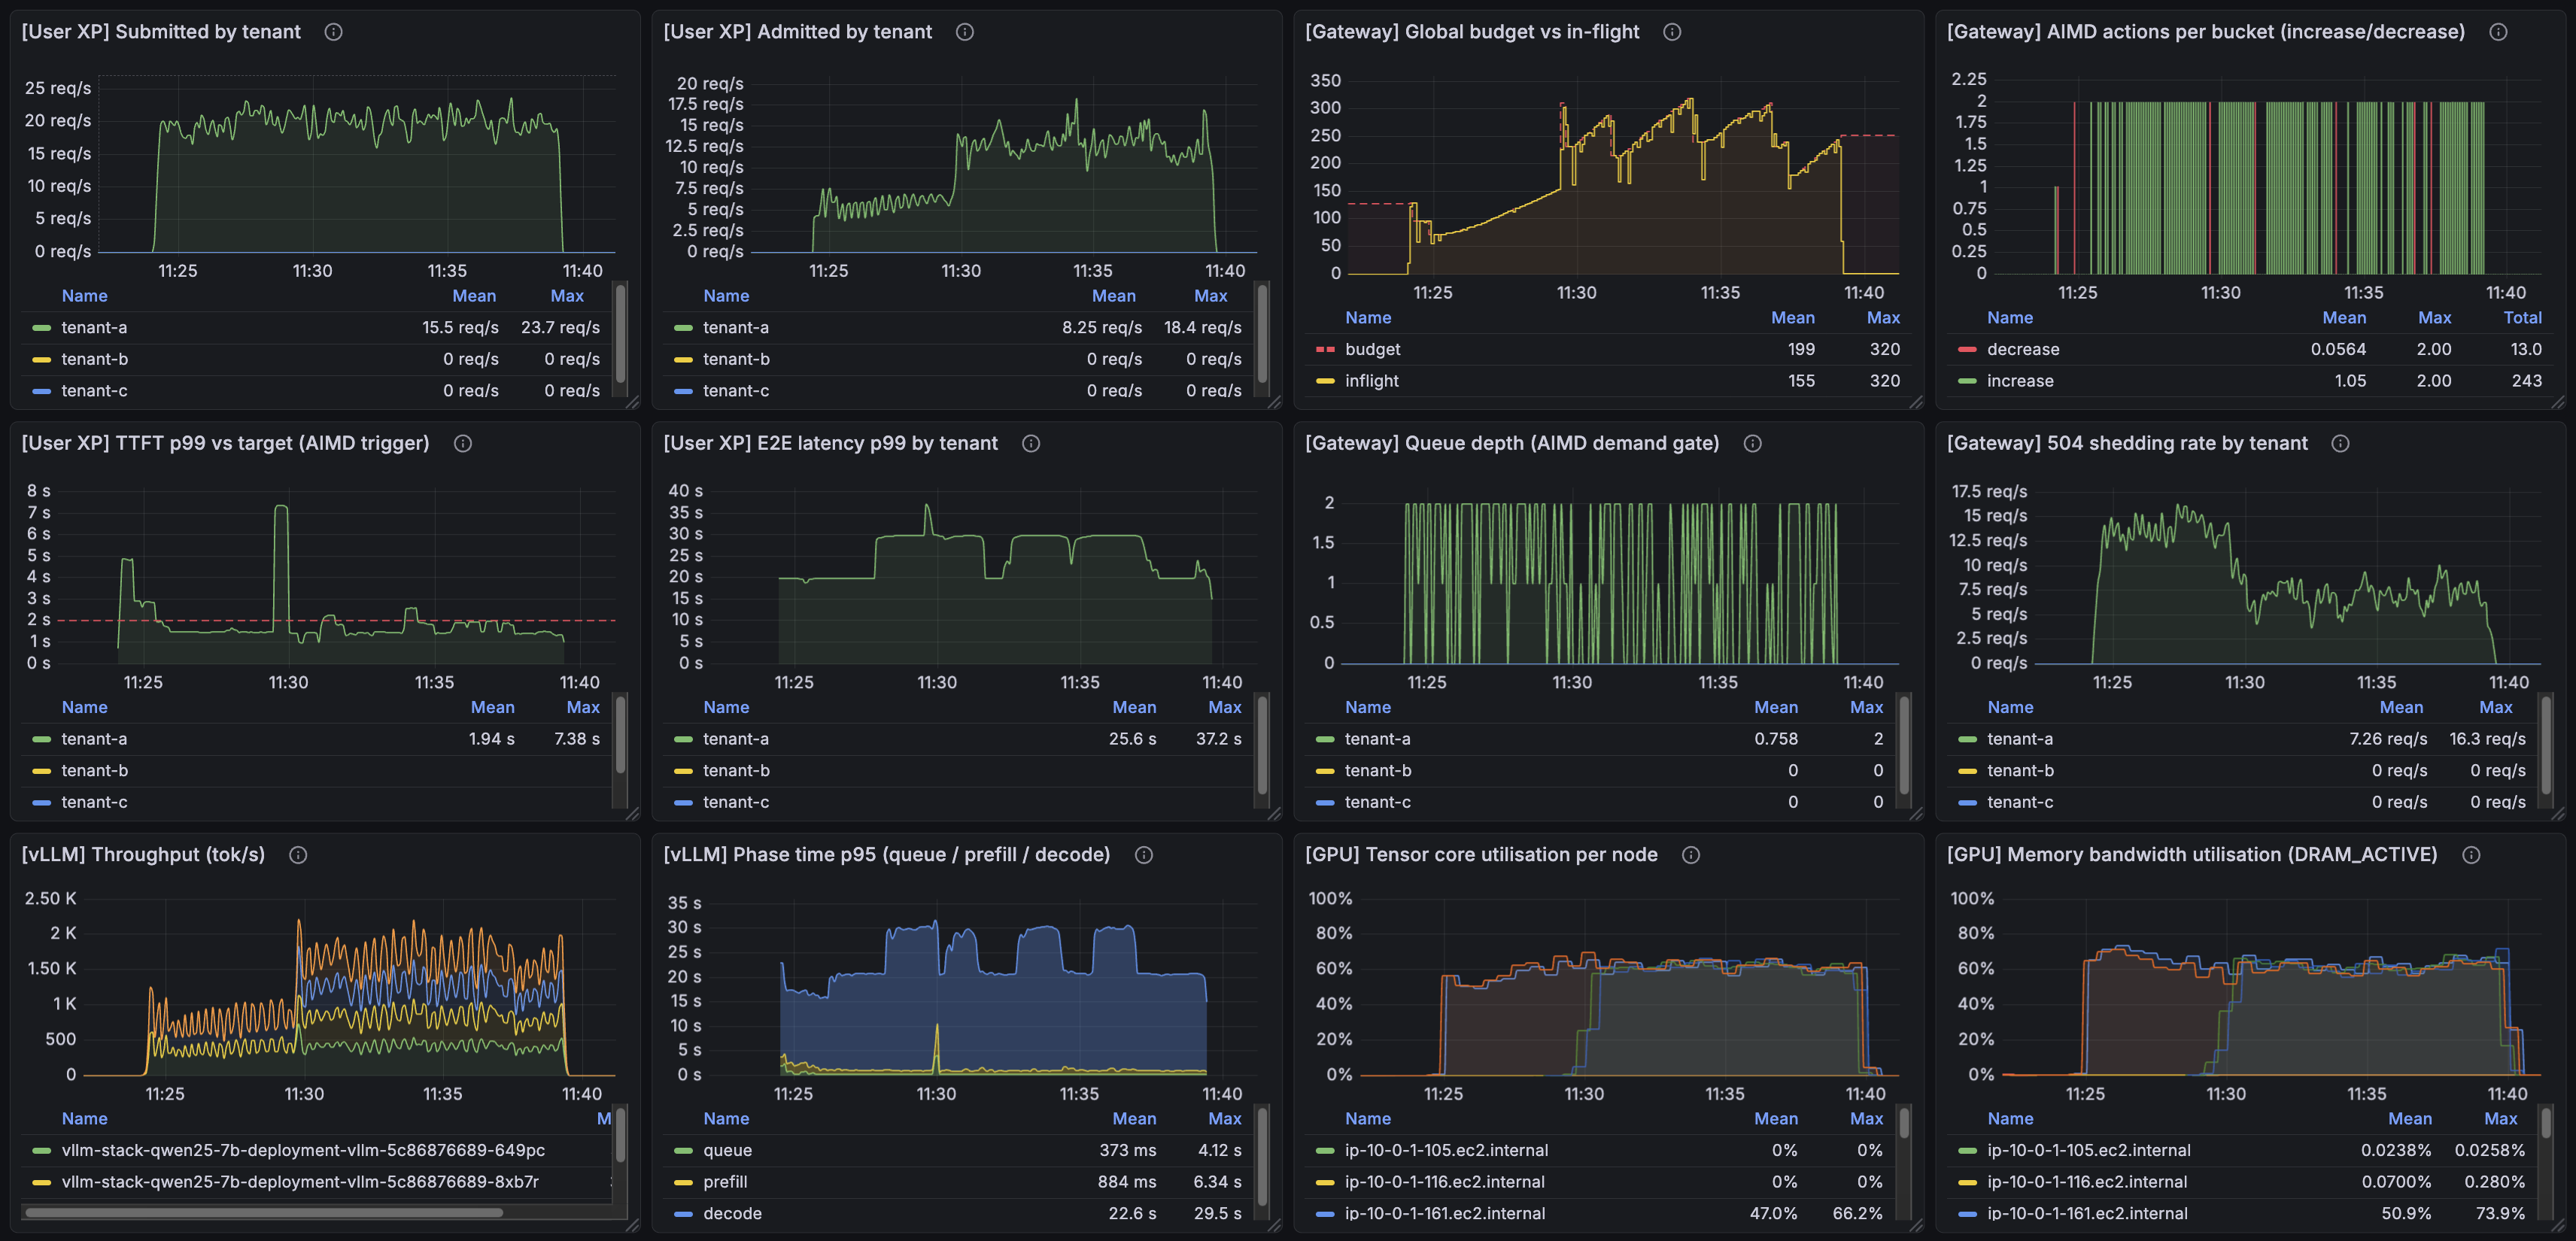
One tenant, one run, a complete arc. Two GPUs at the start; traffic climbs and the scaler steps the fleet to four; traffic calms and the scaler steps it back down to two. The rest of the post is what's in this image and what it took to get there.
The setup
Single tenant in every run in this post. For scaling nodes, the number of tenants doesn't matter — the signals that drive KEDA are not per-tenant. Post #4 needed more than one tenant to make work-conservation under DRR weights visible; here, one tenant makes the autoscaling signal unambiguous and lets the runs be short enough to fit in a demo.
The pieces:
- Gateway from post #4 (DRR + AIMD, target p99 TTFT 2 s).
- vLLM engine Deployment behind it,
num_workersno longer pinned — managed by an HPA driven by KEDA reading the gateway's metrics from AMP. - A "headroom" Deployment carrying the vLLM image, anti-affined one-per-node against the engine pods.
- Karpenter under the node group provisioning g6.2xlarge on demand.
The scenario: tenant A at 20 rps sustained for several minutes, with a tail-off so KEDA's scale-down path is exercised too.
Choosing the scaling signal
Five candidate signals:
| Signal | What it tracks | Outer-loop fit |
|---|---|---|
| GPU utilisation | Hardware busy-ness | Wrong unit. vLLM's continuous batching keeps the GPU pinned even when the engine is healthy — utilisation hits 100% well before the user is in trouble. |
| TTFT p99 | User-visible latency | You can't scale on the signal you're successfully defending. AIMD doesn't let TTFT degrade — it sheds first. The trigger would never fire until the system was already in collapse. |
vllm:num_requests_running |
Concurrent work at the engine | Mixes up capacity with workload shape — the same request rate produces very different in-flight counts depending on the input/output token mix. Scaling on this binds the autoscaler to one assumed prompt shape. |
| Gateway queue depth | Back-pressure inside the scheduler | Right — proactive. The gateway only queues when AIMD can't absorb. Fires before users see 504s. |
| Gateway shed rate (504s/s) | Actual user pain | Right — defensive. When the proactive signal under-reacts, this catches it. |
KEDA allows defining multiple signals and ORs them, so I configured it to look at both gateway queue depth and gateway shed rate (504s/s).
This generalises across workload shapes because both queue depth and shed rate are measured at the gateway, in units of admitted/rejected requests. They don't care what the input/output token mix looks like on any given request. AIMD from post #4 already adjusts cap_per_worker to match the shape mix; KEDA reads the consequence (is the gateway queueing? is it shedding?), not the cause. When AIMD re-tunes the inner loop for a different workload, the outer loop's signals stay valid.
The control loops
inner — AIMD on cap_per_worker (from post #4)     ~5 s tick    latency-driven
outer — KEDA on queue + shed → HPA (new here)     tens of s    SLO-pressure-driven
Karpenter sits underneath as the node provisioner the outer loop depends on once the warm pool is exhausted — it reacts to unschedulable pods on a multi-minute timescale, which is why the warm pool exists in the first place.
Both loops are visible in every run in this post. Karpenter is not exercised here: the scenario scales to a maximum of 4 GPUs, which matches the warm pool. If KEDA wanted a fifth engine, Karpenter would have to provision a fresh node and pull the 21 GB vLLM image on a cold one — a ~10-minute wall, unless a new warm node has already come up by then and is ready to be grabbed. The "What this design doesn't do" section returns to that.
Dampening
Default HPA scaleUp.stabilizationWindowSeconds is 0 — anything that crosses threshold fires immediately, including transient spikes during cold warmup. A 60 s stabilization window plus a step policy of one pod per 30 s keeps the scaler from over-reacting and produces a visible scale-up staircase. Standard control-loop hygiene.
Making scale-up fast enough to keep ahead of traffic
The strategy: a warm pool of nodes with the vLLM image already on disk, so when KEDA fires, the new engine pod doesn't pay a fresh ECR pull on a cold node. With image pull dominated by the 21 GB vLLM image, the difference is concrete: 180 ms on a warm node vs ~9 minutes on a cold one for the same pull, measured directly during the build. Nine minutes is not "scale-up that absorbs a burst"; it's "scale-up that finishes after the burst is gone."
The implementation: a Deployment of "headroom" pods carrying the vLLM image. When KEDA scales engines and a new engine pod is scheduled, anti-affinity forces it onto a node currently held by a headroom pod, which gets evicted. The image is already on the node — pull is a no-op. The headroom pod isn't a separate pre-puller; the headroom pod's image is the pre-puller.
The probe gotcha: /v1/models, not /health
vLLM's /health endpoint returns 200 as soon as uvicorn binds the port — about three seconds after container start. But the engine is still loading weights and capturing CUDA graphs for the next 25–60 seconds. If readiness is gated on /health, the gateway's WorkerCapacityWatcher sees the new pod as Ready, immediately recomputes the global budget to (N+1) × cap_per_worker, and starts dispatching against an engine that cannot serve yet. Requests pile onto a not-ready upstream, and the already-serving engines see a fatter share of the real load because the budget grew without the capacity.
The fix is to gate readiness on /v1/models, which vLLM registers only after weights have loaded. Liveness stays on /health to avoid liveness-killing a busy engine. In other words: when readiness controls how downstream consumers size their budget, the readiness path has to reflect readiness, not just aliveness.
The runs
First, a clean scale-up scenario.
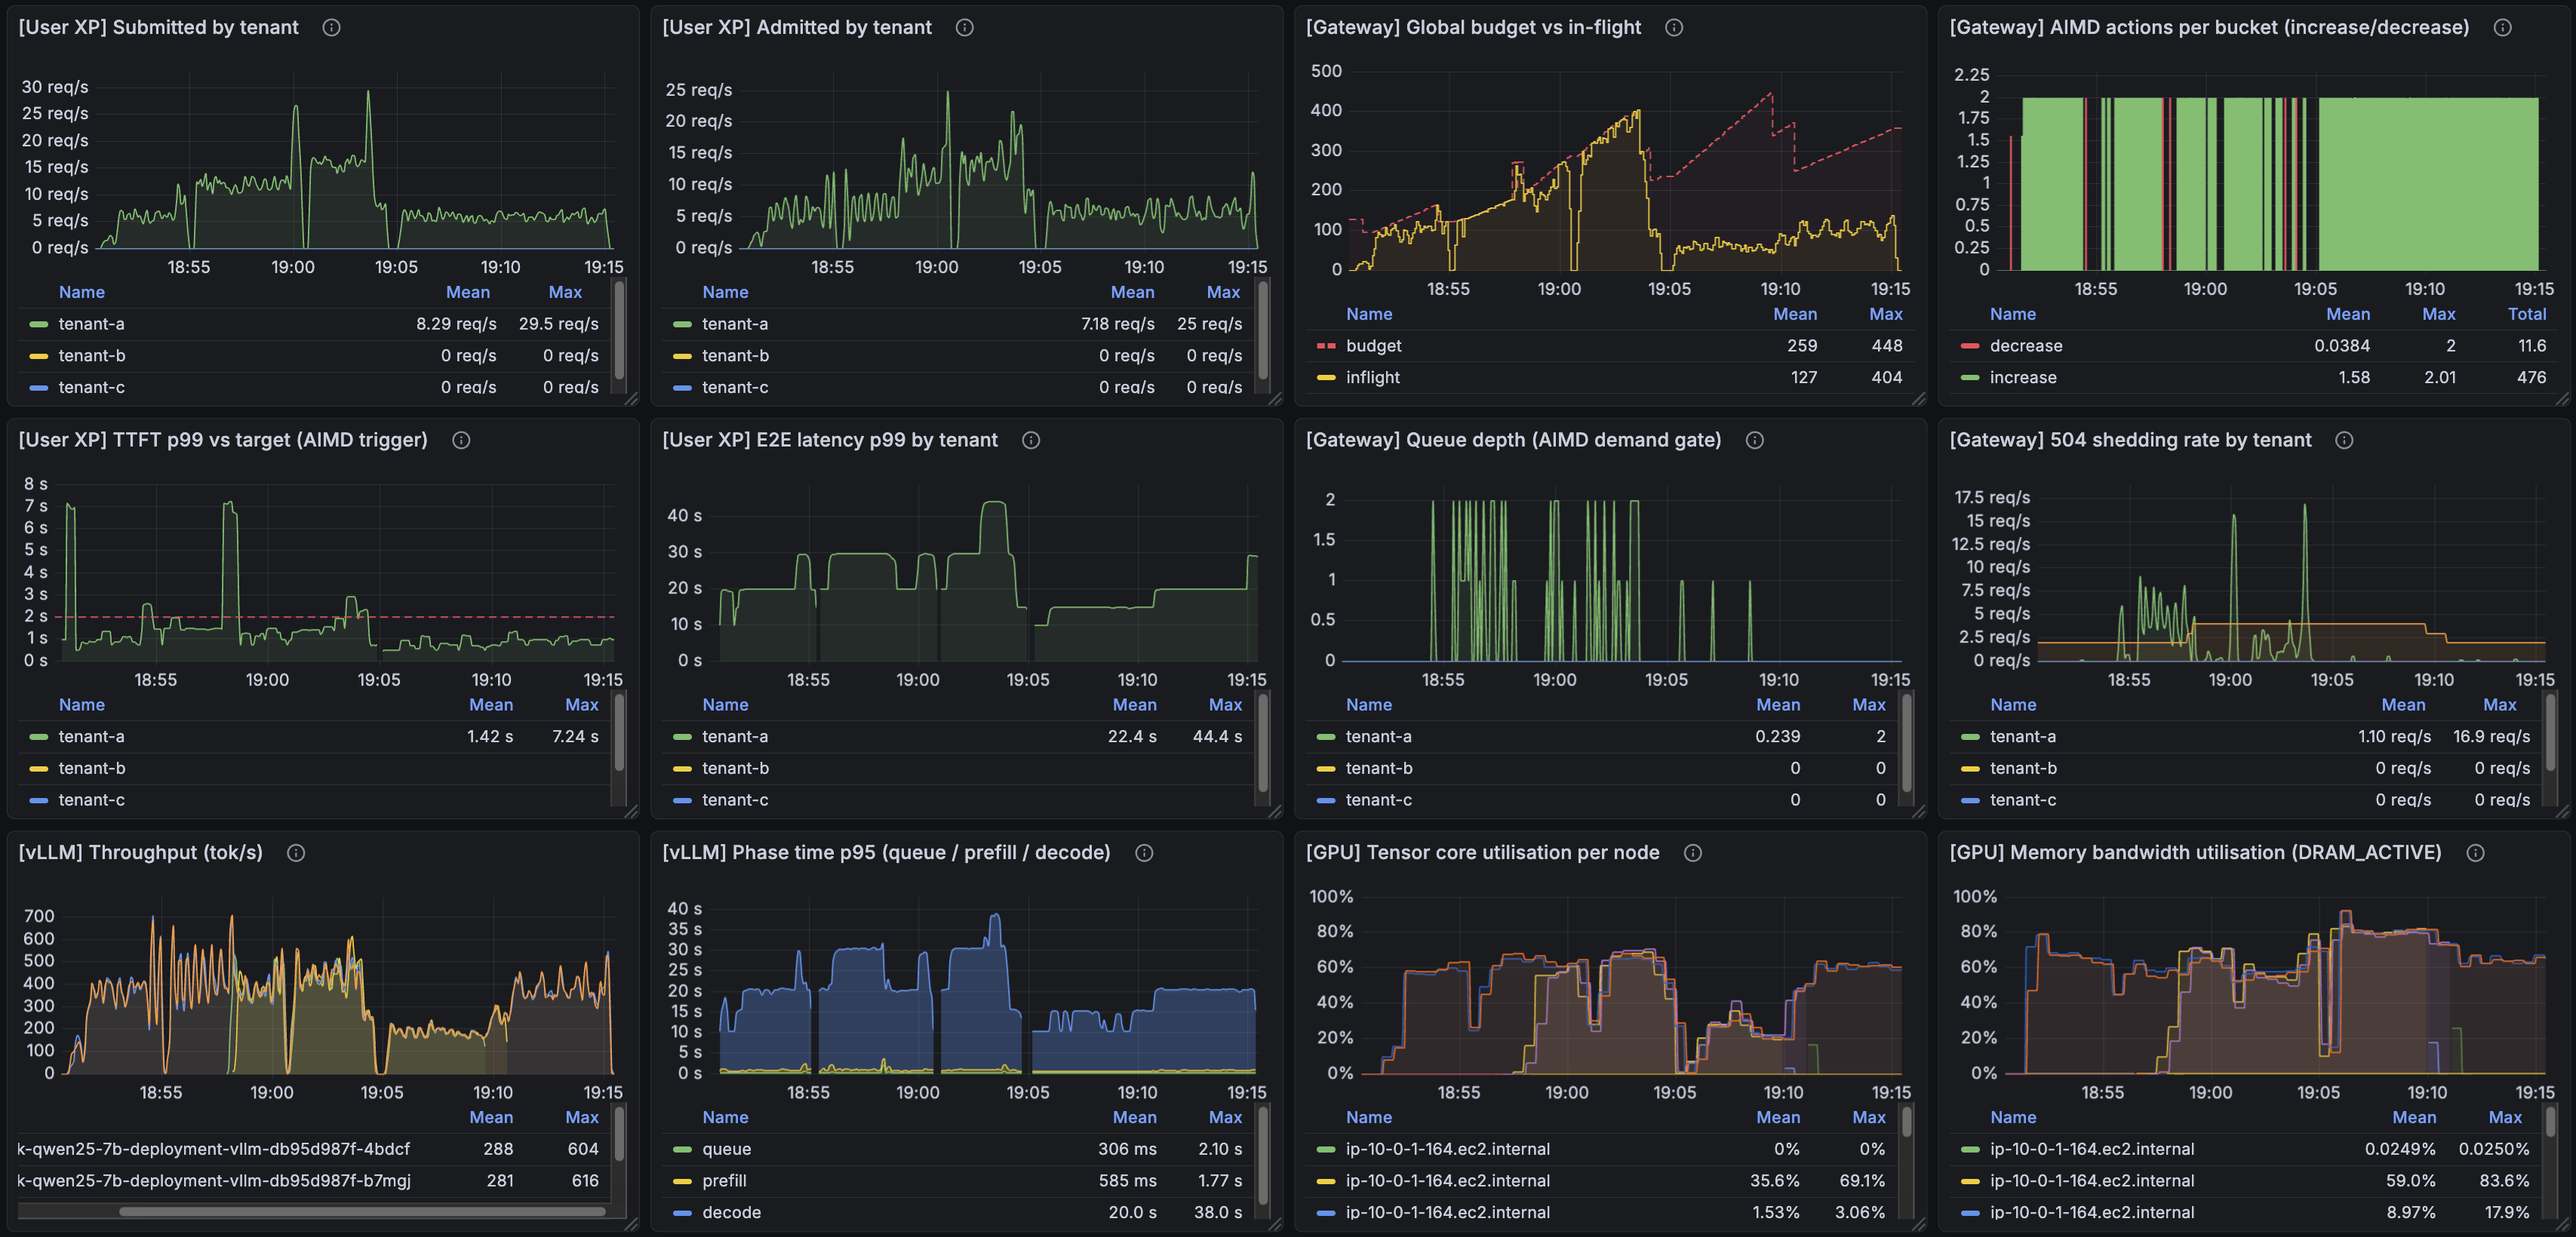
The offered load is constant throughout this run — it does not change from start to finish. With two GPUs at the start, the first half shows heavy 504 shedding: AIMD is at its ceiling, the gateway is correctly refusing requests it can't serve under SLO. Midway, KEDA's queue+shed-rate signals cross threshold; HPA steps the engine count up; two new GPUs come online and the same load is now absorbed with much less shedding.
The interesting moment is visible in the TTFT panel: the moment each new engine joins, its first served requests have visibly high TTFT. The engine has to warm its KV cache; the first few sequences pay for it. That spike is the thing that briefly makes p99 worse before it makes it better. Then AIMD does its job: it observes the spike, cuts cap_per_worker for a tick, and pulls the system back under the 2 s SLO. Shed rate drops by half once the new engines are serving.
Second, the full arc. The image at the top of this post: traffic ramps up, the scaler steps num_workers: 2 → 3 → 4, holds at 4 while load is sustained, then ramps down. After shed rate has been quiet for KEDA's cooldownPeriod, the scaler steps back down to 2. On the "504 shedding rate by tenant" panel, the engine pod count is overlaid as an orange line — its relationship to the shed-rate envelope is the visible explanation for every scale event in the run. Shedding climbs, pod count goes up, shedding drops; shedding stays low, pod count comes back down.
What this design doesn't do
Warm-pool refill. The warm pool is fixed-size in this design — provisioned once, sized to cover the largest scale-up I run against the scenario. Once depleted, the next scale-up beyond the pool size has to provision a cold node and pull the 21 GB image: a ~10-minute wall. One refinement would be to size the pool as a function of current fleet utilisation — a curve that keeps some headroom on top of currently-running engines so the pool grows alongside demand, instead of being a one-time provisioning decision. That doesn't eliminate the cold-node case — a large enough burst can always outrun pool growth — but it eliminates the failure mode where a fleet that has grown to dozens or hundreds of serving nodes still has only a 2-node warm pool sitting behind it. In a production system the warm-pool pods would also be doing something useful — serving low-priority traffic that can be disrupted without breaching an SLA, or handling async requests.
Reactive, not predictive. Every signal in this design is a measurement of current pressure. KEDA fires after the gateway is queueing or shedding — by then the user has already felt the cost of a few seconds of degraded service. For systems where adding capacity is expensive in wall-clock time (GPU nodes, multi-minute image pulls), the bigger win is to predict the ramp from upstream signals — request-rate slope, time-of-day priors, even an upstream load balancer's pre-fan — and pre-scale before the SLO is touched. Eliminating shedding from the user experience entirely is on the other side of that work.
Notes from the build
A few things that came up while building this and didn't fit the arc of the post.
-
The "only 3 rps per engine?" ha-ha moment. I spent a while wondering if something was wrong because my cluster was "only" handling about 3 rps per vLLM engine. Then I realised rps is a user-facing metric, not a capacity-facing one. At any moment each engine is streaming tokens for ~75 concurrent in-flight requests, with average completion time around 25 seconds. In-flight is the right unit for talking about what a continuous-batching engine is actually doing.
-
A real bug in the post #4 AIMD setup, found while building the autoscaler. Going back to the inner loop to validate behaviour under sustained 20 rps, I noticed the SLO wasn't being held cleanly — TTFT was being dragged above 2 s for too long, and the gateway wasn't shedding aggressively enough. The bug: the queue acquire timeout was 30 s, fifteen times the 2 s SLO. A request that waited 30 s in queue had already broken its SLO budget by an order of magnitude; serving it just produced a high-TTFT response that fed a chain reaction (vLLM saturates → AIMD reacts → every active request pays). Cutting the queue timeout to 1 s means the gateway sheds earlier and more, but the requests that do get served stay clean under the SLO. While I was in there I also switched the controller from subtractive (AISD, which is what post #4 shipped with) back to multiplicative (AIMD) — the classic sawtooth, reacts faster to overshoots. Together: the SLO is now kept cleanly, at the cost of more visible shedding. The runs in this post all use the corrected controller.
-
Gateway pod was getting SIGKILLed during heavy shedding. The default 1 s probe timeout was too short for
/healthzto respond while the gateway was managing 300+ concurrent streams, andrequests.cpu: 200mleft the asyncio loop CFS-throttled inside its cgroup quota. Bumping probe timeout to 5 s and CPU request to 400m fixed it — the gateway was under-provisioned for that stream count. -
KEDA's prometheus scaler can't reliably sigv4-sign AMP via EKS Pod Identity. Same IAM policy that works fine for Grafana produces "signature mismatch" 403s from KEDA. Fix: drop an
aws-sigv4-proxysidecar between KEDA and AMP — KEDA treats it as a plain HTTP Prometheus endpoint, the proxy handles sigv4 with its own Pod Identity creds. -
HPA wraps negative external-metric values around to a giant positive integer. An accounting bug in the gateway briefly emitted
gateway_queue_depth = -1. HPA's external-metric API treats values as unsigned, so-1wrapped around to roughly9.2 × 10^18milliunits — the maximum representable value. HPA dutifully scaled tomaxReplicasevery poll cycle. Fix:sum(clamp_min(gateway_queue_depth, 0))in the PromQL.
Repo
Terraform (KEDA install, headroom Deployment, HPA wiring, aws-sigv4-proxy sidecar), Helm values for the engine and gateway, KEDA ScaledObject definitions, bench scenarios, and the dashboard JSON used for the screenshots above are all in the public repo. The runs in this post are reproducible end-to-end against a fresh cluster.